as seen before, the point has no dimension.
an inifinity of times no dimension equals no dimension which is not really interesting when it comes to generative art.
in the previous example, I needed to make the point distribution issue easier to understand so I cheated by representing them in a 2D space but points, have no dimension unless we bind them together.
if we bind 2 points that have no dimension, we obtain our first dimension.
usually, in a 2D space, we figure it out as a “width” or a “length” but a dimension can be thought of as a depth, time, an alpha value, a stroke weight, an increment, a greyscale or anything happening between 2 points or even 2 distinct “states” of a point or any object.
a dimension is the “relationship” between those 2 “states”.
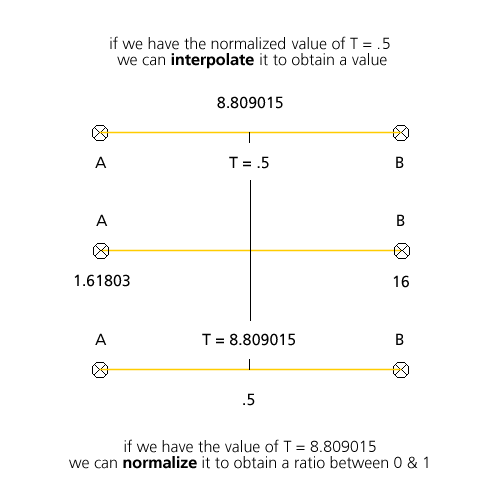
In geometry, that’s where normalization comes in handy: it allows us to get a normalized value ( a value comprised between 0 and 1 ) between 2 arbitrary values.
static public function normalize( value:Number, a:Number, b:Number ):Number
{

	var min:Number = ( a < b ) ? a : b;
	var max:Number = ( a > b ) ? a : b;
	return (value - min) / (max - min);

}
once we have a normalized value, it is also very important to be able to reprensent it in a given dimension.
this is called interpolation or linear interpolation aka lerp. there is a function for that and it goes like:
static public function lerp( t:Number, a:Number, b:Number ):Number
{

	var min:Number = ( a < b ) ? a : b;
	var max:Number = ( a > b ) ? a : b;
	return min + ( max - min ) * t;

}
NB the min / max tests can be removed and/or performed before calling the methods if needed ; I left them for clarity’s sake and so that T is always positive. in a real life scenario we don’t care wether min is smaller than max, they are boundaries. what matters is their relationship to T. and if performance is the word, the methods should be inlined.
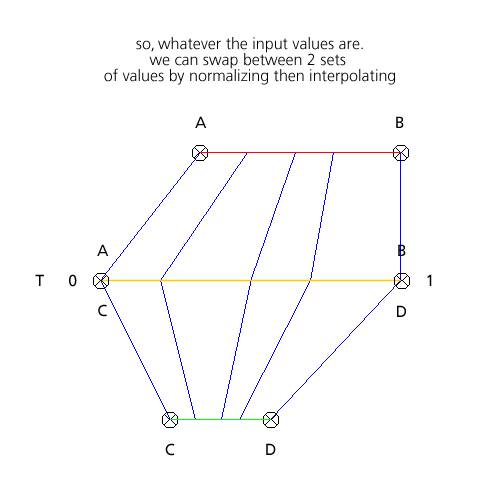
these 2 functions are extremely important when it comes to computational geometry and here’s why:
and an example of an actual use of this:
here’s a quick list of situations where normalization / interpolation are used:
- Math.random() is normalized
- Matrix a, b, c, d values are normalized
- the UV coordinates of a 3D texture are normalized
- Pixel Bender kernels use normalized values to process RGB
- normalization is one of the most useful methods in 2d & 3D vectors calculations
- physics simulations are often normalized (then scaled up to the screen size)
the T variable is also known as the barycenter of the line AB, it is used to compute Bezier curves for instance, we’ll see that later :)
for now we have 1 dimension, 2 values and the possibility to vary between them.
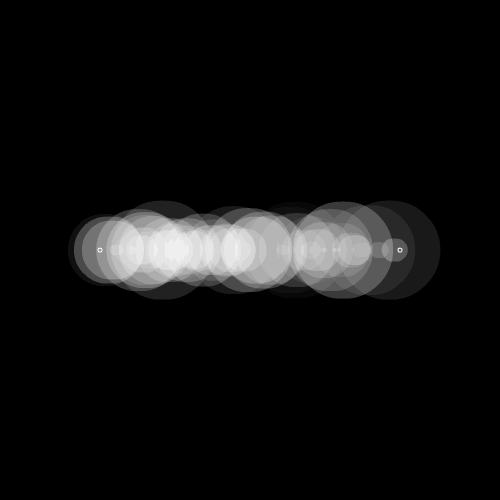
it might seem a bit limited yet it allows a couple of tricks already. as for the points, the question of distribution is crucial ( cf.#2, #3 beneath ) for the sake of the example, I’ll cheat again a little and use no less than 5 dimensions! ( width, height, stroke weight, alpha & time \o/) to illustrate this 1st dimension.
give the animtion the focus then left / right to navigate.
- 0 – is an animation of an normalization / interpolation seen above.
- 1 – I index the graphics.lineStyle( thisckness ) param on the T value of the line ; the closer T is from 1, the thinner the line becomes.
- 2 – this is an article by PIXELERO, he’s to be credited for that and the article is available here: various functions with modulo. I’ve added a greyscale representation underneath to view it as a series of variations on 1 dimension ( 0 to 1 or black to white ). onCLICK, you’ll cycle through the variations.
- 3 – this is also an article by PIXELERO, the article is available here: various functions with different distributions for Math.random(). I’ve also added a greyscale representation underneath to the distributions as a series of variations on 1 dimension ( 0 to 1 or black to white ). onCLICK, you’ll cycle through the variations. the x axis represents the values from 0 to 1, the y axis represents the frequency at which they are drawn ( “drawn” means “picked”, not “renderd to canvas” ).
- 4 – is a regular dashed – line distribution.
- 5 – is a random dashed – line distribution.
- 6 – is a snapped random thickness + alpha on a linear distribution.
- 7 – is a snapped random thickness + alpha on a linear distribution.
for #6 & #7, I’ve used the CapsStyle property of the graphics.lineStyle(…) method and set it to CapsStyle.SQUARE. so I’m not cheating (for once), I don’t draw Circles or squares but really draw a single line, playing on the way it is rendered.
by snapped I mean that the interpolated value (the thickness) will fall between given ranges of values. the method goes like :
static public function snap( value:Number, step:Number ):Number
{
	return int( value / step ) * step;
}
it’s like the “dual” of a modulo the modulo will return the remainder, this gives the ‘stem’ :)
trace( snap( 19, 3 ) );//  18 = 3 * 6 ( + ( 19 % 3 ) = 19 )
trace( snap( 19, 4 ) );//  16 = 4 * 4 ( + ( 19 % 4 ) = 19 )
trace( snap( 19, 10 ) );// 10 = 10 * 1 ( + ( 19 % 10 ) = 19 )
next step: LINES
my beloved readers wrote…